Close menu
Lviv Interactive (LIA) – web-accessible, interactive historical map of the city of Lviv

LIA Interactive City Map

History. Digital Humanities
content image
Project Name
LIA Interactive City
Date

Project goals

  • To create the interactive map that provides different views of the contemporary city in its historical dimension and reflects the complexity of the urban system.
  • To create flexible and easy-to-use digital tools which enable easy and intuitive search through buildings, streets, monuments or all featured objects, or browse the map by region or follow the history of the city through the themes.
  • To create the filters and marks which highlight the particular architectural site, building, person etc. by marks or icons which by clicking display information about the marked object.

Goals achieved

  • We created web-accessible, interactive historical city map powered by Google© Maps
  • Map has a variety of useful functions such as zooming, markers, layers, customization etc.
  • The map dynamically reacts to the search enquiry and/or filtering by categories, marking the places in the city that have corresponding categories and searched words or phrases. As a result the user recieves the marked spot with popup or link to all the available information on the object.
  • Lviv Interactive in image mode has been created, which allows user to search and view the same information as on the map only in its visual version.
  • A storytelling format was used and implemented to describe the history of Bogomolets Street and a virtual walk in Jewish Lviv.
image
image
image

Interactive city map

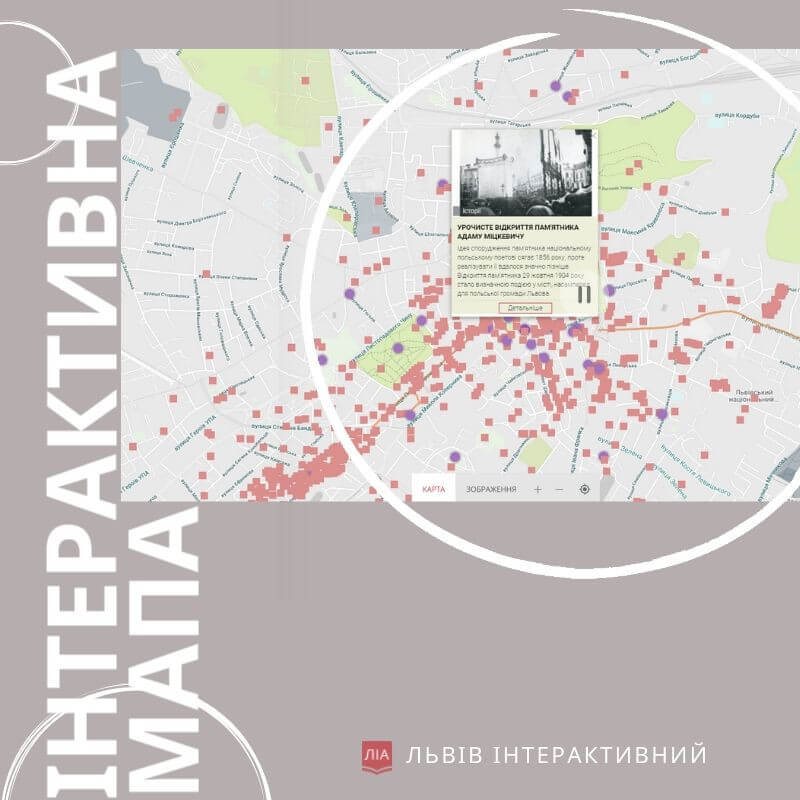
Interactive online map is the main tool for working with the materials of the LIA project.

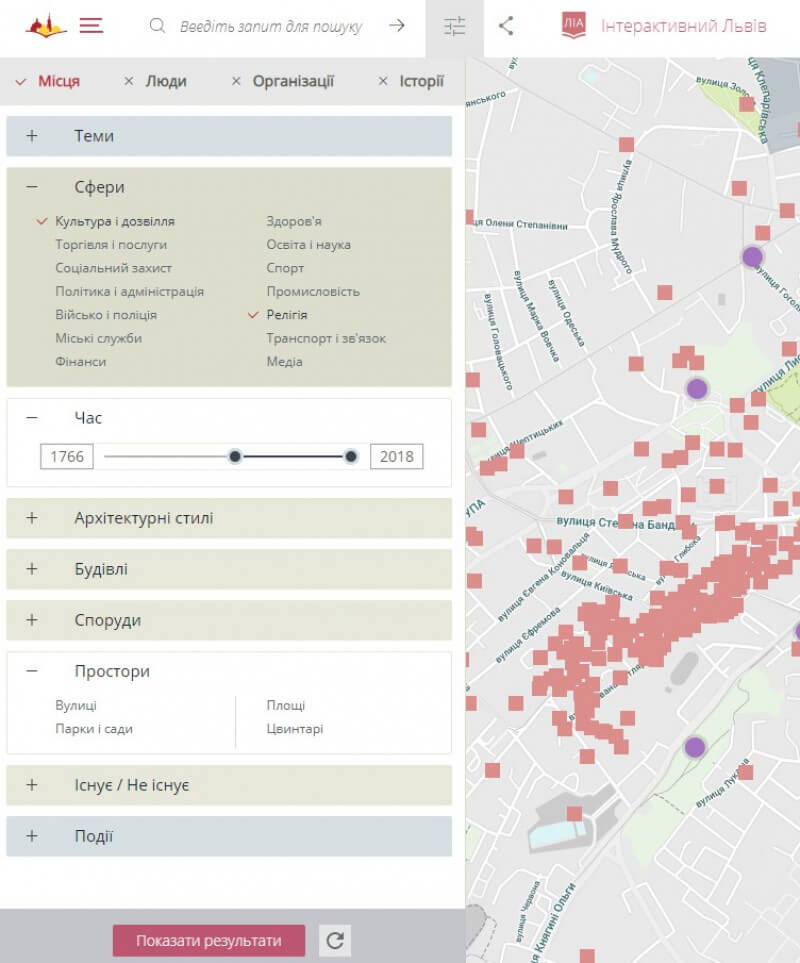
The map shows buildings and other constructions in the form of markers of various types.

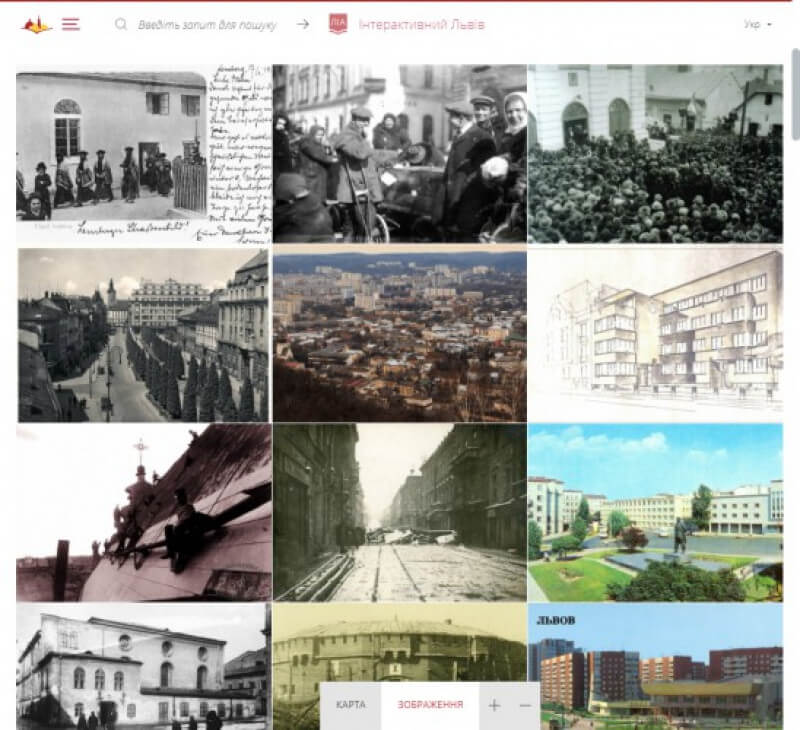
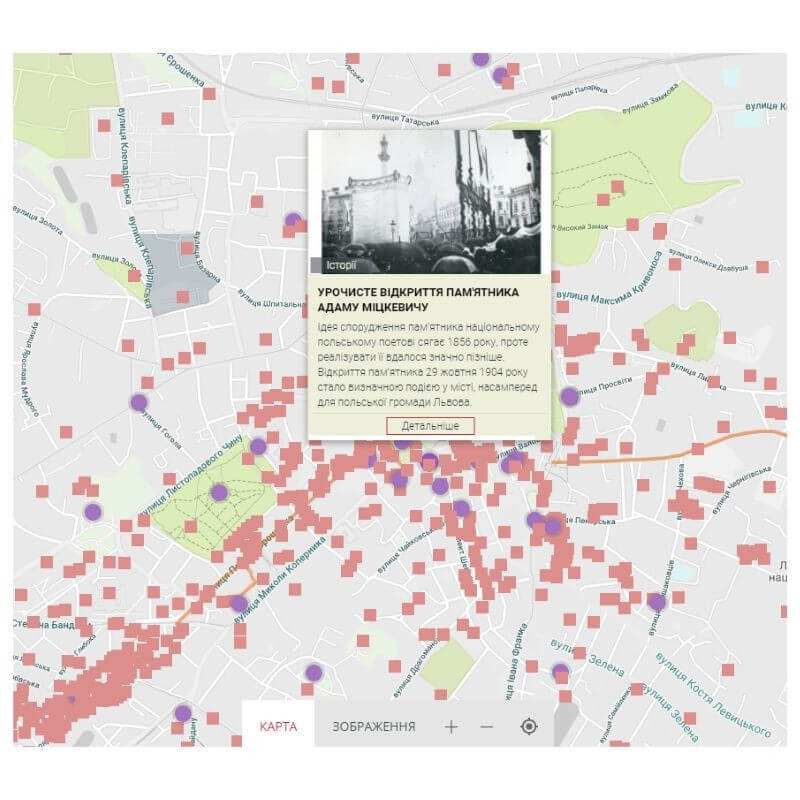
The map allows you to get to know about historical place(s), buildings and related history by clicking on the marker.

Separate spaces, such as streets, squares, cemeteries and parks, are displayed on the map with perimeters that repeat their boundaries.

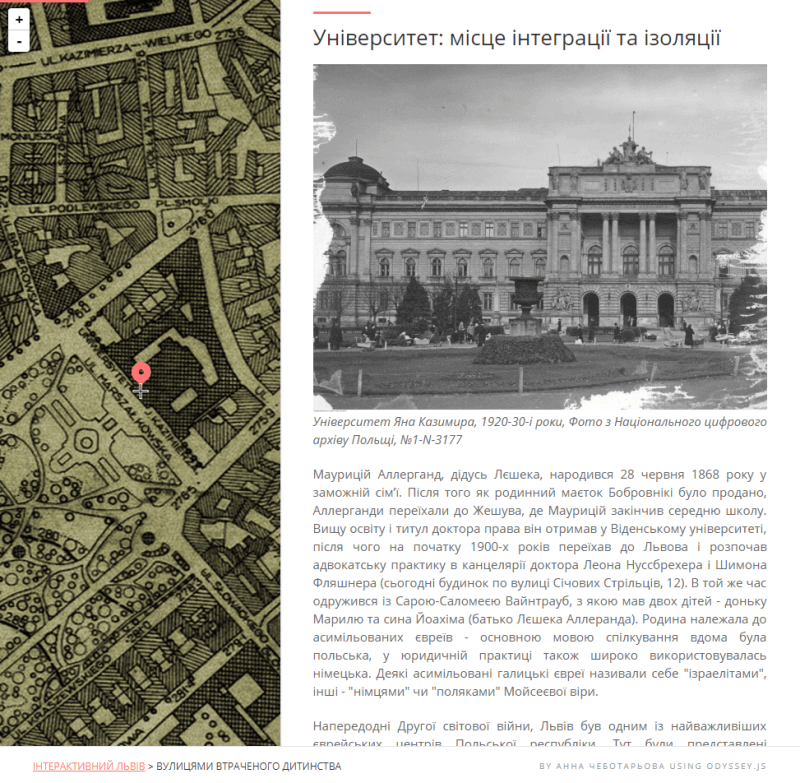
Round purple markers on the map show Stories – research projects, as well as grouped material around the plot accompanying the researchers’ comments.

content image

Ready to discuss your project?

Write to us